How do gold prices stack up against cryptocurrencies and stock markets?
The economy is known for its unpredictable nature, and recent figures indicate that global prices have increased by more than 7% on average as of 20231. Given this, it is more important than ever for us to consider investing in profitable and stable financial opportunities.
Gold has been regarded as the epitome of wealth and success for centuries. Still, with cryptocurrency having emerged into the market in recent years, there are many more investment options to consider. The team at The Gold Bullion Company believes that current gold prices remain at a level of consideration, but how do other options compare?
From inflation to cryptocurrency and global stock markets, we have gathered data from the last five years to analyse the current financial climate and determine how gold stacks up in terms of stability and value.
Gold vs. CPI
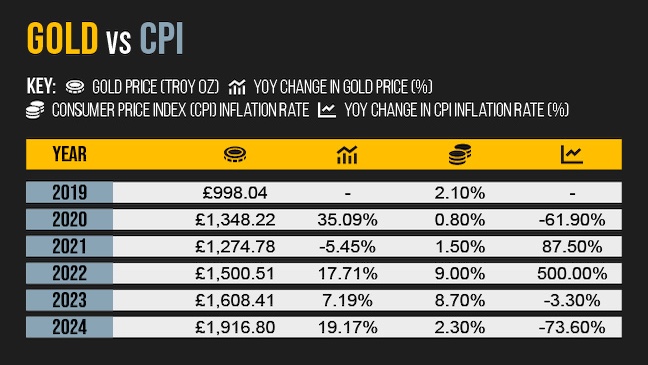
The consumer price index (CPI) measures a country's current economic state by considering a range of goods and services. Unlike gold prices, low CPI inflation rates are generally more favourable in terms of purchasing power, but is the UK's CPI more stable than the value of gold? Here's what we found.
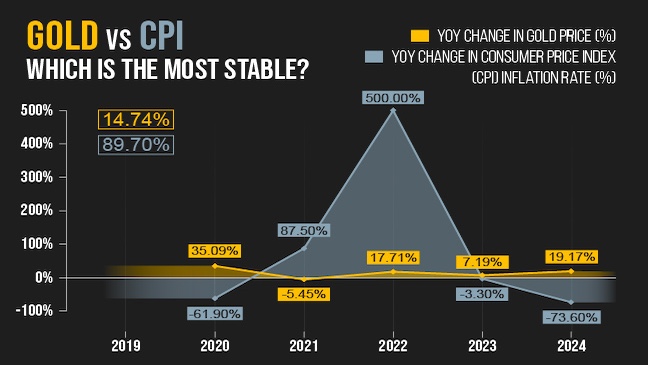
Which is the most stable?
| Year |
Gold Price (Troy oz) |
YoY Change in Gold Price (%) |
Consumer Price Index (CPI) Inflation Rate |
YoYo Change In CPI Inflation Rate (%) |
| 2019 |
£998.04 |
- |
2.1% |
- |
| 2020 |
£1,348,22 |
35.09% |
0.8% |
-61.9% |
| 2021 |
£1,274.78 |
-5.45% |
1.5% |
87.5% |
| 2022 |
£1,500.51 |
17.71% |
9.0% |
500.0% |
| 2023 |
£1,608.41 |
7.19% |
8.7% |
-3.3% |
| 2024 |
£1,916.80 |
19.17% |
2.3% |
-73.6% |
| |
|
14.74% |
|
89.7% |
Over the last five years, the UK's CPI inflation rate has fluctuated. After a five-year high in 2022, this figure has deflated yearly, including a 73.6% decrease between 2023 and 2024. Decreased inflation rates are a positive indicator of investment, providing more opportunities to save money, which you can use to invest in precious metals such as gold.
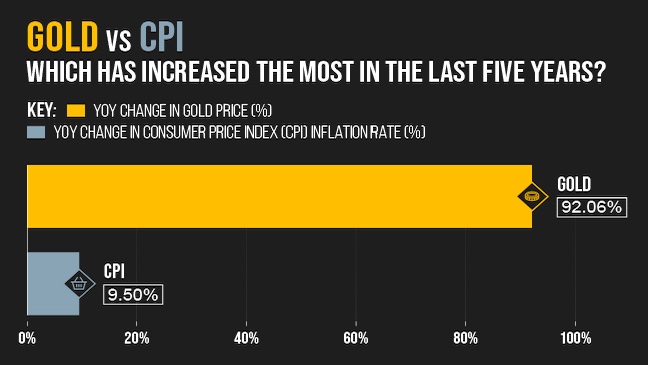
Which has increased the most in the last five years?
| Year |
Gold Price (Troy oz) |
YoY Change in Gold Price (%) |
Consumer Price Index (CPI) Inflation Rate |
YoYo Change In CPI Inflation Rate (%) |
| 2019 |
£998.04 |
- |
2.1% |
- |
| 2020 |
£1,348,22 |
35.09% |
0.8% |
-61.9% |
| 2021 |
£1,274.78 |
-5.45% |
1.5% |
87.5% |
| 2022 |
£1,500.51 |
17.71% |
9.0% |
500.0% |
| 2023 |
£1,608.41 |
7.19% |
8.7% |
-3.3% |
| 2024 |
£1,916.80 |
19.17% |
2.3% |
-73.6% |
| |
|
92.06% |
|
9.5% |
Inflation has increased by 9.5% on average when comparing 2024 to 2019, a concerning figure given the cost of living crisis as the cost of most goods and services rises.
However, compared to five years ago, gold's value has increased by more than 92% — going from £998 to £1,917 — which is almost 10 times higher than the inflation rate.
Gold vs. Bitcoin
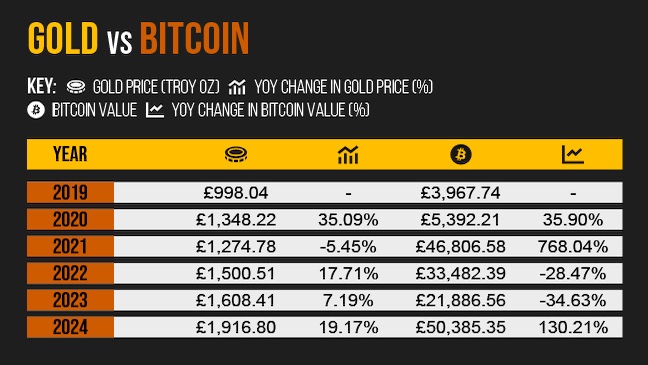
Bitcoin is a pioneer in virtual investment, and since its establishment in 2009, it has become the world’s largest cryptocurrency. Gold and Bitcoin may be on opposite ends of the historical spectrum, but how do they compare in terms of value and stability?
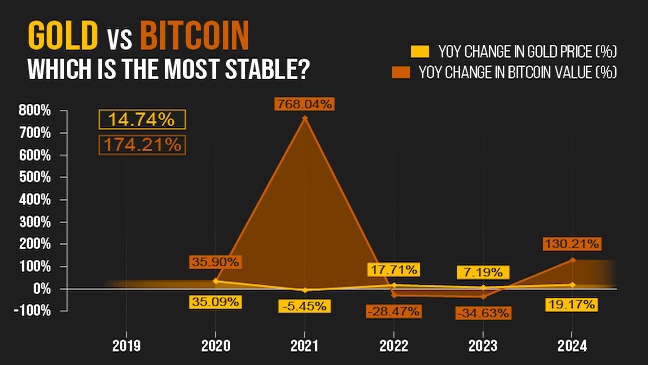
Which is the most stable?
| Year |
Gold Price (Troy oz) |
YoY Change in Gold Price (%) |
Bitcoin Value |
YoYo Change In CPI Inflation Rate (%) |
| 2019 |
£998.04 |
- |
£3,967.74 |
- |
| 2020 |
£1,348.22 |
35.09% |
£5,392.21 |
35.90% |
| 2021 |
£1,500.51 |
-5.45% |
£46,806.58 |
768.04% |
| 2022 |
£1,608.41 |
17.71% |
£33,482.39 |
-28.47% |
| 2023 |
£1,608.41 |
7.19% |
£21,886.56 |
-34.63% |
| 2024 |
£1,916.80 |
19.17% |
£50,385.35 |
130.21% |
| |
|
14.74% |
|
174.21% |
Bitcoin's value has fluctuated over the years, with the worst dip in 2023, when it dropped by 34.6% compared to the previous year (from £33,482 to £21,887). On the other hand, aside from a 5.5% drop in 2021, gold's value has increased steadily, making it a more stable investment, according to data from the last five years.
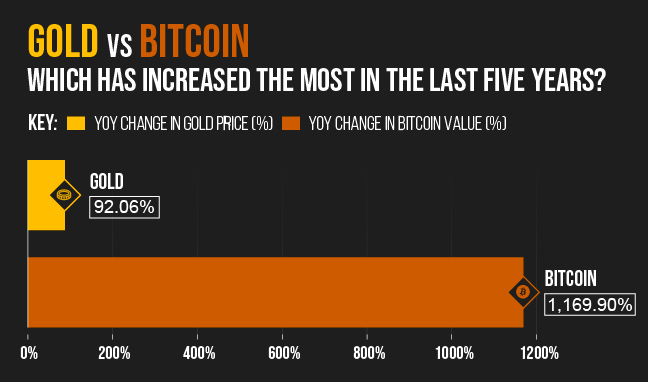
Which has increased the most in the last five years?
| Year |
Gold Price (Troy oz) |
YoY Change in Gold Price (%) |
Bitcoin Value |
YoYo Change In CPI Inflation Rate (%) |
| 2019 |
£998.04 |
- |
£3,967.74 |
- |
| 2020 |
£1,348,22 |
35.09% |
£5,392.21 |
35.90% |
| 2021 |
£1,274.78 |
-5.45% |
£46,806.58 |
768.04% |
| 2022 |
£1,500.51 |
17.71% |
£33,482.39 |
-28.47% |
| 2023 |
£1,608.41 |
7.19% |
£21,886.56 |
-34.63% |
| 2024 |
£1,916.80 |
19.17% |
£50,385.35 |
130.21% |
| |
|
92.06% |
|
1,169.9% |
Even at its lowest of £3,968 back in 2019, Bitcoin has long had an impressive value. Between 2019 and 2024, the value of this cryptocurrency increased by more than 1,100%, compared to the 92.1% increase in the value of gold over the same period. However, as revealed earlier, it is worth noting that Bitcoin is a much riskier investment than gold.
Gold vs. Dogecoin
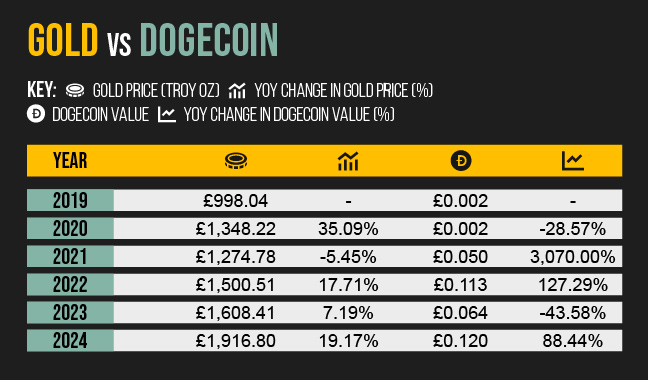
Nicknamed ‘the people’s cryptocurrency’, Dogecoin has been a digital currency for over a decade. Despite initially being created as a joke, it has been predicted that this light-hearted payment system has a future as an investment opportunity.
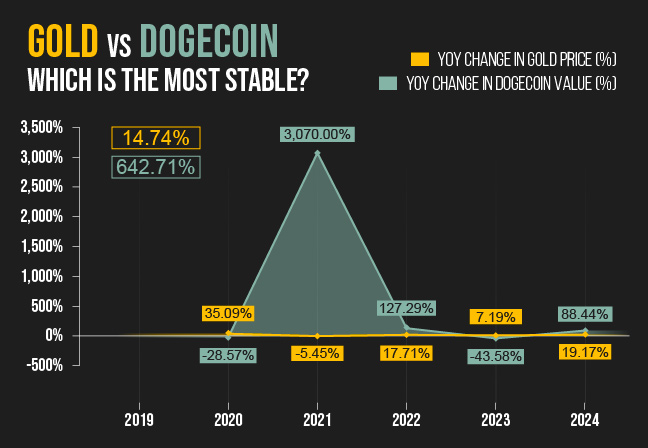
Which is the most stable?
| Year |
Gold Price (Troy oz) |
YoY Change in Gold Price (%) |
Dogecoin Value |
YoYo Change In Dogecoin Value (%) |
| 2019 |
£998.04 |
- |
£0.002 |
- |
| 2020 |
£1,348,22 |
35.09% |
£0.002 |
-28.57% |
| 2021 |
£1,274.78 |
-5.45% |
£0.050 |
3,070.00% |
| 2022 |
£1,500.51 |
17.71% |
£0.113 |
127.29% |
| 2023 |
£1,608.41 |
7.19% |
£0.064 |
-43.58% |
| 2024 |
£1,916.80 |
19.17% |
£0.120 |
88.44% |
| |
|
14.74% |
|
642.71% |
Gold is a much better option than Dogecoin if you want a stable investment. Regarding value, Dogecoin has seen many ups and downs over the last five years, including a 3,070% spike in 2021 and a 43.6% dip in 2023.
Meanwhile, gold has stayed much more stable over the years, only experiencing a decrease in value during April 2021, when the price of one troy oz of gold temporarily fell from £1,348 to £1,275.
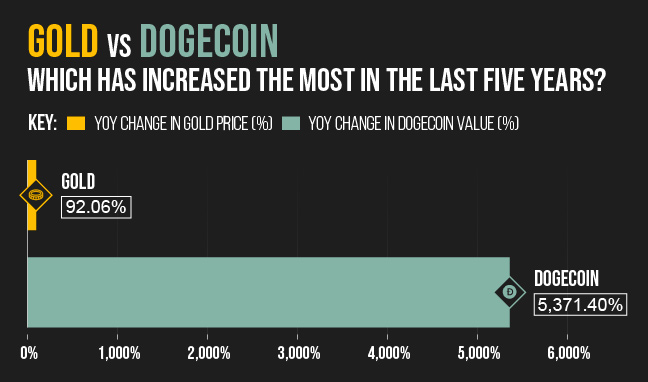
Which has increased the most in the last five years?
| Year |
Gold Price (Troy oz) |
YoY Change in Gold Price (%) |
Dogecoin Value |
YoYo Change In Dogecoin Value (%) |
| 2019 |
£998.04 |
- |
£0.002 |
- |
| 2020 |
£1,348,22 |
35.09% |
£0.002 |
-28.57% |
| 2021 |
£1,274.78 |
-5.45% |
£0.050 |
3,070.00% |
| 2022 |
£1,500.51 |
17.71% |
£0.113 |
127.29% |
| 2023 |
£1,608.41 |
7.19% |
£0.064 |
-43.58% |
| 2024 |
£1,916.80 |
19.17% |
£0.120 |
88.44% |
| |
|
92.06% |
|
5371.4% |
Dogecoin may have increased in value over the last five years more than gold, but is it a worthwhile investment? As of 2024, this cryptocurrency is valued at 5,371% more than in 2019, compared to gold, which has increased slowly. Having said this, with a current value of less than a pound, you won’t make any big bucks from Dogecoin without plenty of patience.
Gold vs. Ether
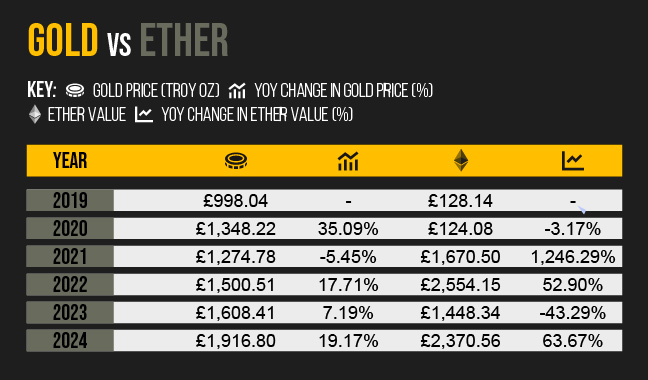
Ether is native to the Ethereum blockchain, and after going live in 2015, this cryptocurrency has become one of the most prominent digital currencies in the world. The following data reveals how Ether compares to gold regarding investment opportunities.
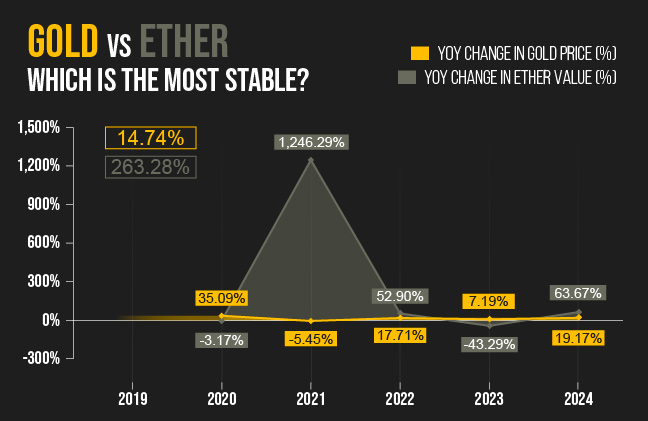
Which is the most stable?
| Year |
Gold Price (Troy oz) |
YoY Change in Gold Price (%) |
Ether Value |
YoY Change In Ether Value (%) |
| 2019 |
£998.04 |
- |
£128.14 |
- |
| 2020 |
£1,348,22 |
35.09% |
£124.08 |
-3.17% |
| 2021 |
£1,274.78 |
-5.45% |
£1,670.50 |
1,246.29% |
| 2022 |
£1,500.51 |
17.71% |
£2,554.15 |
52.90% |
| 2023 |
£1,608.41 |
7.19% |
£1,448.34 |
-43.29% |
| 2024 |
£1,916.80 |
19.17% |
£2,370.56 |
63.67% |
| |
|
14.74% |
|
263.28% |
Once again, gold has been revealed as the most stable investment option. Even though Ether has seen massive spikes in value over the last five years, this cryptocurrency is deemed more risky when considering the trends in value since 2019. Most notably, Ether’s worth dropped by more than 43% from £2,554 in 2022 to less than £1,450 in 2023.
While Ether is new and exciting, gold has cemented itself as a stable investment option, evidenced by its 14.7% average year-on-year change over the last five years compared to Ether’s 263.3%.
Which has increased the most in the last five years?
| Year |
Gold Price (Troy oz) |
YoY Change in Gold Price (%) |
Ether Value |
YoYo Change In Ether Value (%) |
| 2019 |
£998.04 |
- |
£128.14 |
- |
| 2020 |
£1,348,22 |
35.09% |
£124.08 |
-3.17% |
| 2021 |
£1,274.78 |
-5.45% |
£1,670.50 |
1246.29% |
| 2022 |
£1,500.51 |
17.71% |
£2,554.15 |
52.90% |
| 2023 |
£1,608.41 |
7.19% |
£1,448.34 |
-43.29% |
| 2024 |
£1,916.80 |
19.17% |
£2,370.56 |
63.67% |
| |
|
92.06% |
|
1750.0% |
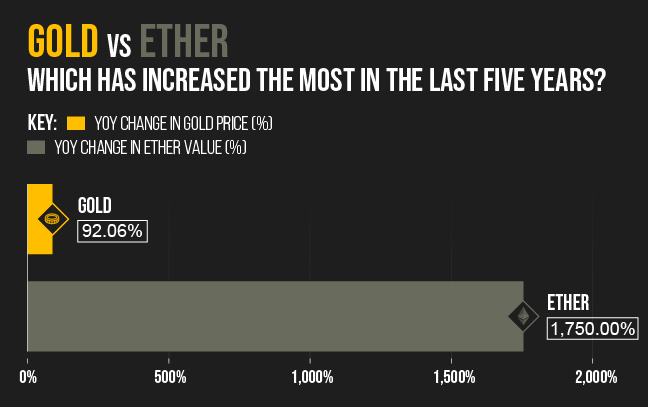
If you want to purchase one Ether in today’s market, it will cost just over £2,370. However, it hasn’t always been that way; just five years prior, one Ether was worth £128. Compared to Ether’s 1,750% increase in value, gold falls short with a 92.1% increase. Despite this, it is evident that both commodities have become much more valuable since 2019.
Gold vs. Global Stock Markets
Stock market indices measure financial performance in different regions based on company stock purchases. Although many factors influence market performance, a high index score indicates a better investment opportunity. However, stock market indices famously change like the wind. Bearing this in mind, how do some of the biggest global stock markets compare to the value of gold? Here's what we found.
Financial Times Stock Exchange 100 (FTSE) - UK
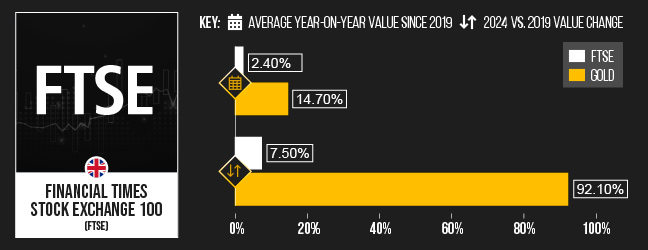
FTSE average year-on-year value since 2019: 2.4%
FTSE 2024 vs. 2019 value change: 7.5%
Gold average year-on-year value since 2019: 14.7%
Gold 2024 vs. 2019 value change: 92.1%
The FTSE comprises 100 of the most valuable companies on the London Stock Exchange by market capitalisation, one of the best-known measures of the UK economy's performance. Since taking a hit in 2020, the FTSE has been steadily growing, and with an average index change of 2.4% in the last five years, this stock market is the most stable on our list.
The FTSE may be a stable investment, but gold is more worthwhile in terms of its change in value. While the FTSE stock market performance has increased by 7.5% since 2019, the value of gold is 93.3% more than it was five years prior.
EURO STOXX 50 (SX5E) - Europe
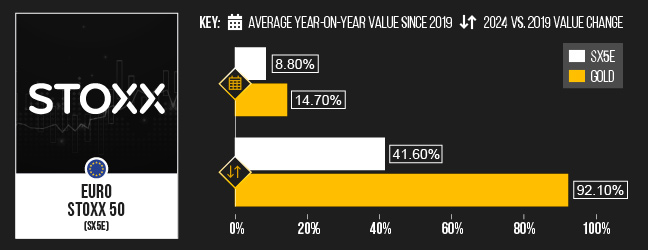
SX5E average year-on-year value since 2019: 8.8%
SX5E 2024 vs. 2019 value change: 41.6%
Gold average year-on-year value since 2019: 14.7%
Gold 2024 vs. 2019 value change: 92.1%
The SX5E is widely used by investors looking to make money in Europe. The 50 companies included in this index are regularly reviewed and updated, which means that this stock market always represents the current economic situation.
In terms of performance, the SX5E is in a much better position than it was five years ago, with its index score increasing by more than 41% compared to 2019.
Dow Jones Industrial Average (DJIA) - USA
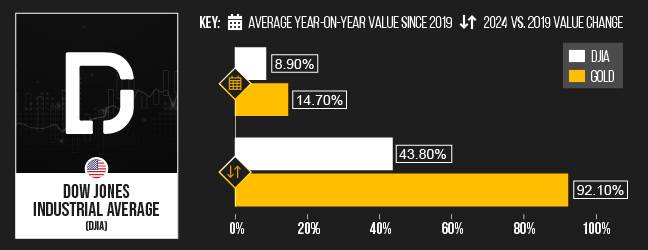
DJIA average year-on-year value since 2019: 8.9%
DJIA 2024 vs. 2019 value change: 43.8%
Gold average year-on-year value since 2019: 14.7%
Gold 2024 vs. 2019 value change: 92.1%
No country has a more considerable net wealth than the USA, and because of this, it may come as no surprise that the DJIA has the biggest index of all the stock markets on this list.
The value of gold has increased more in the last year than the DJIA index, but the American stock market appears to have remained relatively stable based on the average performance since 2019.
Shanghai Stock Exchange Composite Index (SSE Composite Index) - Asia
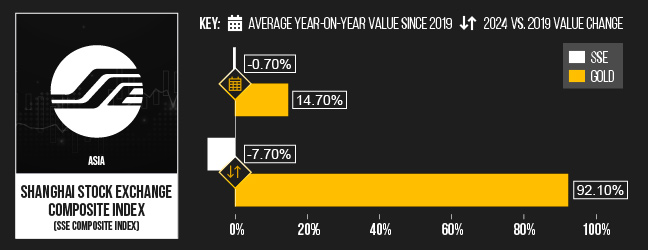
SSE average year-on-year value since 2019: -0.7%
SSE 2024 vs. 2019 value change: -7.7%
Gold average year-on-year value since 2019: 14.7%
Gold 2024 vs. 2019 value change: 92.1%
SSE Composite Index is the only stock market on our list to have suffered a decrease in performance over the last five years, dropping from 3,271 in 2019 to 3,019 in April of this year.
When stock markets aren't performing well, people are more likely to hold onto gold, increasing its demand and value. While this may not be ideal for companies, it is good news for gold.
S&P/ASX 200 - Australia
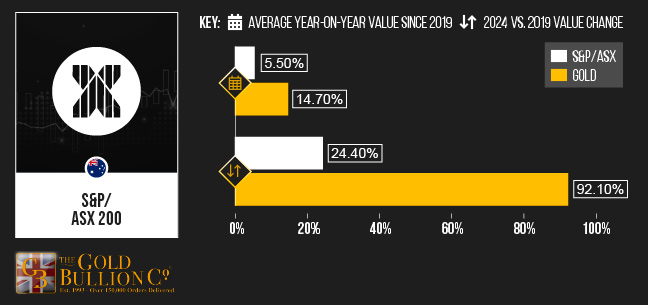
S&P/ASX average year-on-year value since 2019: 5.5%
S&P/ASX 2024 vs. 2019 value change: 24.4%
Gold average year-on-year value since 2019: 14.7%
Gold 2024 vs. 2019 value change: 92.1%
Recent S&P/ASX 200 stock market indices are indicative of economic growth in Australia, with an average change of more than 5% over the last five years.
The S&P/ASX 200 has also been quite stable when comparing 2024 to 2019, increasing in value by 24.4% between the two years.
Expert comment: Based on our findings, what advice would you give someone looking to invest?
Cameron Parry, CEO of gold currency provider and bank challenger at TallyMoney:
“The stability of gold priced in GBP relative to changes in GBP inflation is insightful. A direct comparison of gold priced in GBP versus GBP priced in gold is particularly enlightening. Since the start of this century, gold has increased on average at a rate of 10.56%p.a. against GBP. In absolute terms gold has increased from £176.20 per ounce, circa 1,000% uplift in GBP.
“The investment performance of gold, cryptos and stocks needs to be balanced with understanding their other differences. Firstly, if you don't understand what you're getting, then probably don't invest in it - which, for most people, should rule out cryptos. Gold is a different class of asset to the others. Most people understand that gold is a safe, stable store of value. And whilst the price fluctuates in the short term, the value never falls off a cliff. Whereas a crypto can go to zero, and indeed so can stocks if a listed company goes under
“Even amongst cryptos, there's a very wide range. Whilst Bitcoin has matured into an established speculative asset class and is deflationary by design, and Ether has novel functionality value, Dogecoin's value seems to stem from celebrity rather than innovation, and it is inflationary by design. The performance of stocks also shows a wide range of performance depending on the market, and even more so if investing in specific companies within those markets.
“So recognising that you're not comparing apples with apples with these investment options is crucial to consider, along with returns. The right balance can be struck with the right mix - with Bitcoin's potential for ultra-high returns, you don't need to hold a lot of it to generate as much as you would from the rest of your portfolio if it was in gold for example. Which is handy as Bitcoin comes with big risks, and gold comes with low risk. As for GBP, painfully, almost insultingly, GBP is designed to lose value over time in real terms - the Bank of England's target is to devalue the pound by 2% a year, although the real loss of value is reflected in rising prices over time, which happens at a considerably faster pace.”
Methodology
We used The Gold Bullion Company to find the gold price for every year between 2019 and 2024 in UK pound sterling per troy ounce. Data was collected on 10/06/2024 and was taken from April 10th where available. For 2020 and 2021, data from April 9th was taken, April 11th for 2022 and 2023, and April 12th for 2024.
We used Statista to find the inflation rate for the UK’s Consumer Price Index for April every year between 2019 and 2024.
We used Google Finance to find the value of Bitcoin, Dogecoin, and Ether for every year between 2019 and 2024. Data was collected on 10/06/2024 and taken from April 10th where available. Data for 2019, 2020, 2022, 2023, and 2024 were taken from April 13th, 11th, 9th, 8th, and 13th, respectively.
We used Google Finance to convert the original data from USD to GBP. At the time of conversion, 1 USD = 0.783 GBP.
We used Google Finance to find the index of the following stock markets for every year between 2019 and 2024: Dow Jones Industrial Average, EURO STOXX 50, Financial Times Stock Exchange, SSE Composite Index, and S&P/ASX 200.
Data was collected on 12/06/2024 and taken from April 10th where available. Indices were taken from the following dates:
- DJIA: 9th April (2020, 2021), 12th April (2019, 2024), 14th April (2022, 2023)
- SX5E: 9th April (2020, 2021), 12th April (2024), 14th April (2022, 2023), 18th April (2019)
- FTSE: 9th April (2020, 2021), 12th April (2019, 2024), 14th April (2022, 2023)
- SSE Index: 9th April (2021), 10th April (2020), 12th April (2024), 14th April (2023), 15th April (2022), 19th April (2019)
- S&P/ASX 200: 9th April (2020), 12th April (2024), 14th April (2022, 2023), 16th April (2021), 18th April (2019)
We subtracted the 2020 value from the 2019 value before dividing this by the 2020 value to calculate each factor’s yearly inflation increase. This calculation was repeated for every year between 2019-2024.
We subtracted the 2024 value from the 2019 value before dividing this by the 2024 value to calculate each factor's five-year change in value.
Using the YoY percentages for each year, we calculated each factor's average change in value across the last five years.
1 https://www.eiu.com/n/campaigns/worldwide-cost-of-living-2023