Buying power of gold

For decades, gold, from items encased in gold to solid gold bars, has been a constant depiction of wealth and buying power. Not only that, but it’s a symbol that represents the stability of wealth. After all, gold will always be worth its weight in…well, gold.
But are those who buy gold bars in a better position than those who invest in properties, for instance?
Well, the experts at The Gold Bullion Company have delved deep into the data to answer that question. We’ve looked at how the prices of gold and different types of properties in the UK have changed over the last few decades. We have also researched how many ounces of gold you’d need for a 10% deposit on properties in various UK regions as well as other big purchases. Additionally, we analysed how the price of gold and the Consumer Price Index (CPI) has changed from 1990–2024.
Big purchases vs gold 2024: the cost of life’s bigger purchases weighed in gold
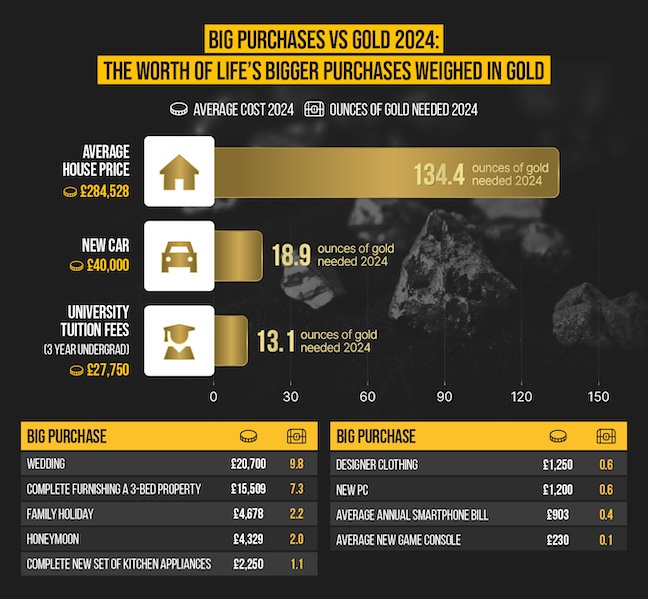
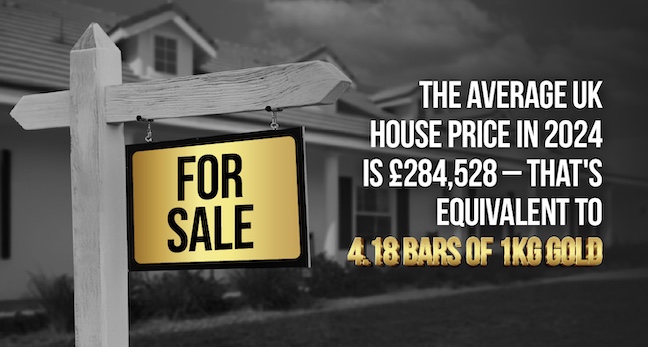
Some of the bigger purchases that we have made occasionally can certainly be hefty, especially when compared to gold. For example, the most expensive big purchase on our list, the average cost of a new house, would set you back 134.4 ounces of gold, or over £284,000.
On the lower end of the spectrum, a new game console and the average annual phone bill require the lowest ounces of gold, at just 0.2 and 0.4, respectively. And then the average cost of a new PC or designer clothing would set you back around £1,200 each or 0.6 ounces of gold.
A new car would be the second most expensive large purchase in the UK, costing on average £40,000 in 2024 or 18.9 ounces of gold. Three years of an undergrad degree at an English university will cost around 13.1 ounces of gold and a wedding is priced at around 9.8 ounces on average.
Ounces of gold needed for big purchases, then and now
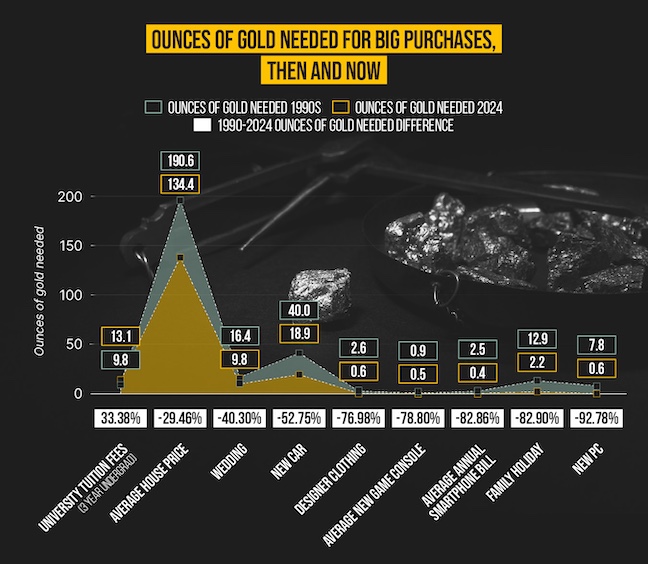
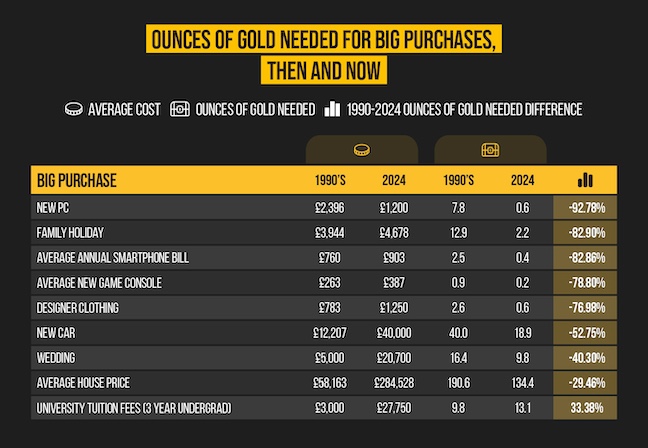
As the cost of big purchases has increased, so too has the price of gold. In this section, we’ll be looking at which of life’s large expenses have increased the most since 1990. Over the years, there have been major decreases in the ounces of gold required for most purchases.
Among the biggest decreases in ounces of gold required for more substantial purchases are a new PC, a family holiday (for four), and the average annual phone bill. All three have seen at least an 82% decrease in the ounces of gold needed, outlining how gold can retain its worth and even outmanoeuvre inflation.
The one instance where the cost of gold has been beaten is university tuition fees, which have risen at a rate that gold couldn’t quite keep up with. In fact, despite increasing calls to abolish university tuition fees, in 2025, they’re likely to increase by £250 to £9,500 a year3.
Is gold a good investment against inflation?
In this section, we’ll examine the consumer price index (CPI), which is a direct indication of the inflation in the prices of goods in the UK. We will also pit the CPI against the price of gold to see if gold can truly serve as a safe hedge against inflation.
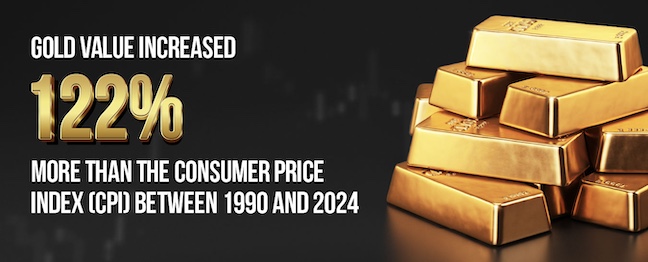
The average CPI score from 1990 to 2024 is 86.93, with an average increase of 2.74% per year during that time. Gold, on the other hand, has increased in worth by more than double the rate of inflation in the UK.
This data indicates that while gold prices can be volatile and influenced by a range of variables, its recent long-term pricing shows a certain stability and increase. It also shows that investing in a fiat currency may not be able to keep up with the erosion of purchasing power compared with gold.
Ounces of gold needed for a deposit on UK properties
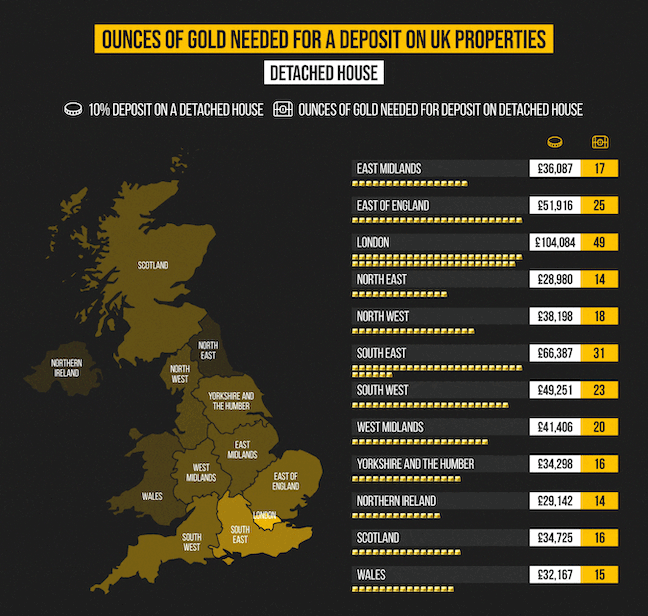
UK property prices have increased massively in the last 50 years. In 1974, the average price was £10,0271 versus the 2024 average of £284,528, marking a 2,697% increase. And most banks in the UK require first-time house buyers to put down a 10% deposit. As of 2024, the median deposit in the UK tends to be between £35,000 and £45,0002. But are UK properties worth their weight in gold?
The major outlier is London, which is to be expected, given that the capital has a property demand which far exceeds its stock. This is most evident in the case of detached houses, where a 10% deposit on average is £104,084 in 2024, which would require 49 ounces of gold to cover the cost.
On the other end of the spectrum, the North East of England is one of the most affordable across the different property types, where an average 10% deposit requires a maximum of 14 ounces of gold.
There’s also an interesting comparison between the two eastern regions, with properties in the East of England being quite a bit more expensive than in the East Midlands. The average ounces of gold needed for a 10% deposit in the East is just over 16, a bit higher than the average of 11 ounces in the East Midlands.
In terms of property types, terraced houses have the highest average difference between the most and least expensive regions, with London being nearly four times more expensive than the North East for a 10% deposit on a terraced house. And then, for flat prices, a 10% deposit in London is almost two times more expensive than the next most expensive region, the South East.
Price differences 1995-2024: UK properties vs gold
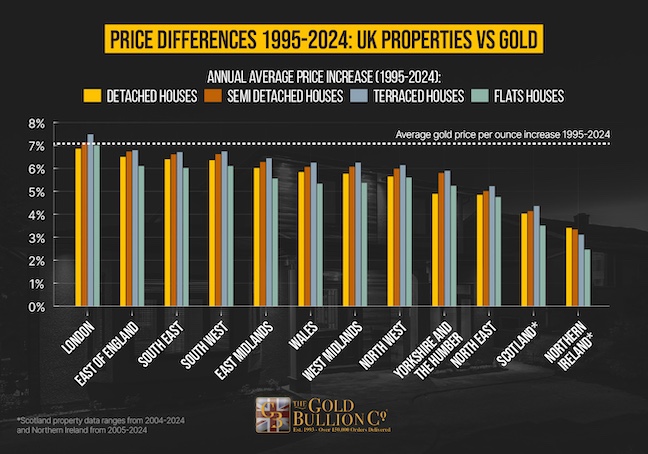
* Scotland property data ranges from 2004-2024 and Northern Ireland from 2005-2024
As we’ve stated, property prices have changed quite a lot over the last few decades, however, so too has gold. On average, the price of gold has increased by roughly 7.05% per year since 1995 to now. But which regions and property types have managed to keep in stride with the increase in gold prices?
London has remained the most consistently priced region compared to gold price increases, with increases in property prices within 0.5% since 1995. Flats in London were the closest to gold price increases over this time period, with a difference of just 0.05%, and then semi-detached houses at 0.08%. Again, with the number of working professionals in the capital, flats are in extremely high demand, so they tend to hold their prices very well.
Northern Ireland is the region where property prices haven’t inflated in line with gold, making the precious metal more desirable to the Irish. On average, all property prices have increased just 3.08% since 2005, almost 4% less than gold.
Flats are the property type that has held its value the least against gold, with the average price increase across all regions in the UK being 5.25% since 1995, 1.8% lower than the average increase in gold prices, 7.05%.
Methodology
To begin with, we sourced average house pricing data for September 2024 from HM Land Registry. This allowed us to look at the average price of various property types (detached, semi-detached, terraced, and flats) by region. Using this, we were able to calculate the average cost of a 10% deposit for these properties.
We then used The Gold Bullion’s Live Gold Price tracker to record the current cost of gold per ounce in GBP. This data was taken on 25/11/2024 at 07:36 GMT. We then used the above Land Registry data to calculate how many ounces of gold you’d need for a 10% deposit for properties in the UK.
Using data from the HM Land Registry to analyse the price differences in various property types throughout the UK by region from 1995 to 2024. Note: For Scotland and Northern Ireland, we could only get housing prices from 2004 to 2024.
We used Macro Trends to calculate the average gold price from 1995 to 2024 in USD, which allowed us to calculate the average price increase. This enabled us to compare the difference in gold and property price increases over the last couple of decades. Note: using Google Finance, we converted the prices from USD to GBP; prices are accurate as of 25/11/2024 at 9:30 GMT.
Using a range of sources, such as Hitched, Auto Express, Who What Wear, and GAME, we sourced the average cost of several big purchases, such as a wedding, a new car, designer clothing, and a new game console. We then used sources such as Which, Marriage Foundation, and LA Times to get the price of those big purchases from the 1990s. We then used the above gold pricing data to calculate the ounces of gold needed for these purchases in 2024 and the 1990s to compare the difference.
Lastly, we used the above Macro Trends gold data alongside the Consumer Price Inflation tables (table 57) from the Consumer Price Inflation team to compare the average increase of gold and the CPI from 1990 to 2024.
References:
-
https://www.thisismoney.co.uk/money/mortgageshome/article-14114017/What-like-buying-home-1974-vs-2024-harder-ladder-now.html
-
https://better.co.uk/mortgages/house-deposit#:~:text=What%20our%20data%20says:%20average,July%202024%20is%2030%20years.
-
https://www.dailymail.co.uk/news/article-14040195/Now-thats-call-U-turn-Anger-Keir-Starmer-RAISES-student-tuition-fees-9-535-despite-pledging-ABOLISH-four-years-ago.html